
Generate Audiogram Online Softwear
If you’ve recently undergone a hearing test, your audiologist may have handed you a chart filled with symbols, lines, and numbers. That chart is called an audiogram — one of the most important tools used to evaluate hearing health.
An audiogram is a visual representation of how well you hear sounds across different frequencies and volumes. It helps audiologists identify the type, degree, and pattern of hearing loss, making it easier to recommend the right treatment, hearing aid, or medical intervention.
With EarMart’s free online audiogram creator, you can now easily plot, view, download, and print your hearing test results online within minutes.
Audiogram Online – Free Hearing Test Report Generator | EarMart
What Is an Audiogram?
An audiogram is a graph that shows the softest sounds a person can hear at different pitches or frequencies. Hearing thresholds are measured in decibels Hearing Level (dB HL) and plotted for both the left and right ears separately.
The test typically evaluates hearing across standard frequencies ranging from 250 Hz to 8000 Hz, which cover the sounds most important for speech understanding.
Audiograms are commonly used by:
- Audiologists
- ENT specialists
- Hearing aid professionals
- Speech-language pathologists
- Schools and educational institutions
Why Is an Audiogram Important?
An audiogram provides detailed information about your hearing ability and helps identify:
- The degree of hearing loss
- The type of hearing loss
- The configuration or pattern of hearing loss
- Whether hearing loss is stable or worsening over time
It also helps determine whether hearing loss originates in the:
- Outer ear
- Middle ear
- Inner ear
- Auditory nerve
This information is critical when selecting hearing aids, medical treatments, or therapy options.
Create an Audiogram Online for Free
EarMart Online Audiogram Creator allows users to generate professional audiograms online without installing any software.
Key Features of EarMart’s Audiogram Plotter
✅ Completely Free
No registration, subscription, or hidden charges.
✅ Supports All Standard Audiogram Types
The tool supports:
- Air Conduction (AC)
- Bone Conduction (BC)
- Masked Air Conduction
- Masked Bone Conduction
These are plotted using internationally recognized audiology symbols and standards.
✅ Instant PDF Download
Generate and print audiograms as PDF files for:
- ENT consultations
- Hearing aid fittings
- School records
- Telehealth appointments
- Personal documentation
✅ 100% Private & Secure
All audiogram plotting happens locally on your device. Your hearing data is never stored or uploaded.
✅ Mobile-Friendly Design
Use the tool on:
- Android phones
- iPhones
- Tablets
- Desktop computers
No app installation required.
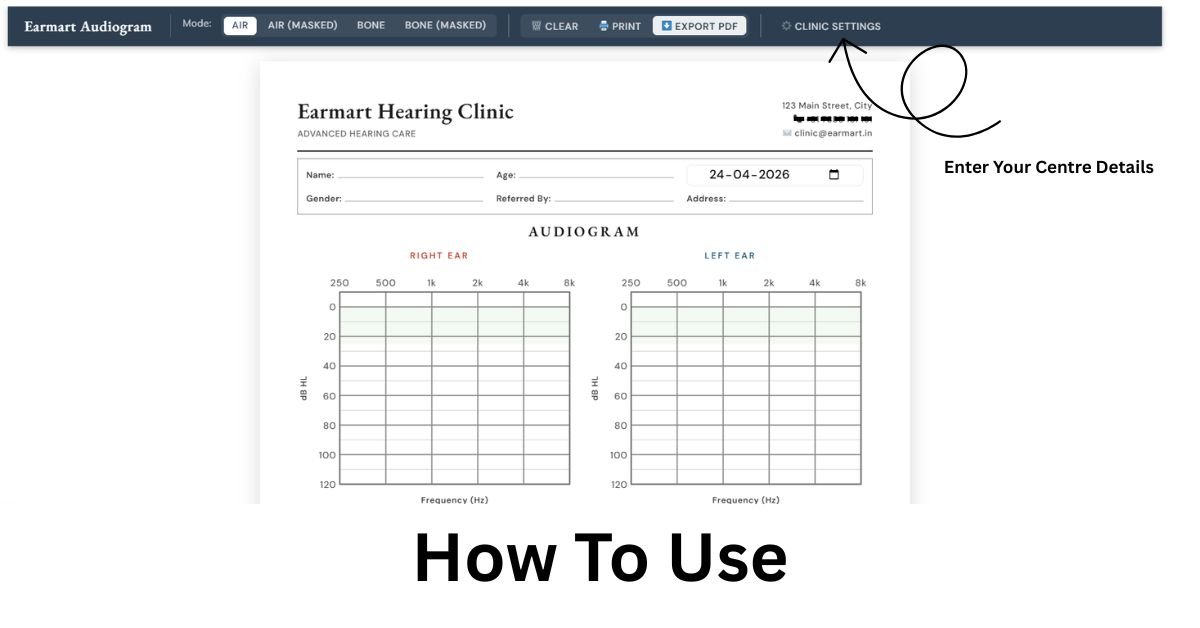
How to Plot an Audiogram Online
Creating your audiogram using EarMart is simple:
- Visit EarMart Audiogram Generator
- Enter hearing threshold values for each frequency
- Select left and right ear test results
- Choose air conduction or bone conduction options
- Instantly generate your audiogram chart
- Download or print your audiogram as a PDF
The interface is designed for both professionals and first-time users.
Understanding Audiogram Symbols
Audiograms use standardized symbols to represent hearing test results.
| Symbol | Meaning |
|---|---|
| O | Right Ear Air Conduction (Unmasked) |
| X | Left Ear Air Conduction (Unmasked) |
| △ | Right Ear Air Conduction (Masked) |
| □ | Left Ear Air Conduction (Masked) |
| < | Right Ear Bone Conduction |
| > | Left Ear Bone Conduction |
| [ | Right Ear Bone Conduction Masked |
| ] | Left Ear Bone Conduction Masked |
Typically:
- Red symbols represent the right ear
- Blue symbols represent the left ear
These standards are used worldwide in clinical audiology.
What Can an Audiogram Reveal?
1. Degree of Hearing Loss
Hearing loss is generally classified as:
- Normal
- Mild
- Moderate
- Moderately Severe
- Severe
- Profound
2. Type of Hearing Loss
An audiogram can identify:
- Conductive hearing loss
- Sensorineural hearing loss
- Mixed hearing loss
3. Hearing Loss Pattern
Different patterns may indicate different causes, such as:
- Flat hearing loss
- Sloping hearing loss
- Rising hearing loss
- Noise notch
- Ski-slope configuration
Common Hearing Loss Patterns Seen on Audiograms
Age-Related Hearing Loss (Presbycusis)
Usually appears as gradual high-frequency hearing loss.
Noise-Induced Hearing Loss
Often shows a distinct notch around 4000 Hz.
Conductive Hearing Loss
Typically presents with an air-bone gap between AC and BC thresholds.
Sudden Sensorineural Hearing Loss
Shows a rapid drop in hearing in one ear across multiple frequencies.
Middle Ear Disorders
Conditions like otosclerosis may show flat conductive hearing loss patterns.
Who Can Benefit from an Online Audiogram Creator?
Patients & Individuals
Track hearing changes over time and maintain personal hearing records.
Audiologists & Hearing Clinics
Use the tool during teleconsultations or remote patient counseling.
Parents of Children with Hearing Loss
Easily share hearing reports with teachers, schools, and specialists.
Students & Researchers
Generate professional audiograms for projects, research papers, and presentations.
Speech Therapists & Educators
Use audiograms during therapy planning and educational assessments.
Tips for Accurate Audiogram Plotting
- Always use hearing test results from a certified audiologist
- Double-check left and right ear values before plotting
- Use masked thresholds when available
- Save PDFs after every hearing test for comparison
- Carry printed audiograms to hearing consultations
Why Regular Hearing Tests Matter
Hearing loss often develops gradually and may go unnoticed for years.
According to the World Health Organization, over 1.5 billion people worldwide experience some degree of hearing loss.
Regular hearing evaluations help:
- Detect hearing loss early
- Prevent further damage
- Improve communication ability
- Support better hearing aid outcomes
- Protect long-term hearing health
Just like eye checkups and dental visits, hearing tests should be part of your routine healthcare.
Frequently Asked Questions About Audiograms
Is EarMart’s audiogram creator free?
Yes. The tool is completely free with no signup required.
Is my hearing data stored online?
No. All data processing happens locally on your device.
Can I use the audiogram tool on mobile?
Yes. The audiogram creator works on smartphones, tablets, and desktops.
Which frequencies are supported?
The tool supports standard audiometric frequencies:
- 250 Hz
- 500 Hz
- 1000 Hz
- 2000 Hz
- 4000 Hz
- 8000 Hz
Can I plot both ears together?
Yes. Left and right ear results are displayed on the same audiogram chart.
Can this replace a professional hearing test?
No. The tool is designed for visualization and documentation only. Professional diagnosis should always come from a qualified audiologist or ENT specialist.
Start Plotting Your Audiogram Today
Understanding your hearing health begins with understanding your audiogram.
With EarMart’s Free Online Audiogram Creator, you can quickly visualize, save, print, and share your hearing test results from any device.
- No software installation
- No signup required
- Completely free
- Mobile-friendly
- Professional audiogram charts
Protect your hearing health by keeping track of your audiograms regularly and consulting a qualified audiologist whenever changes occur.